Features

From blocks to results.

01 · Build

Blocks on a canvas, code beside them.

Choose a block, and its code lights up.
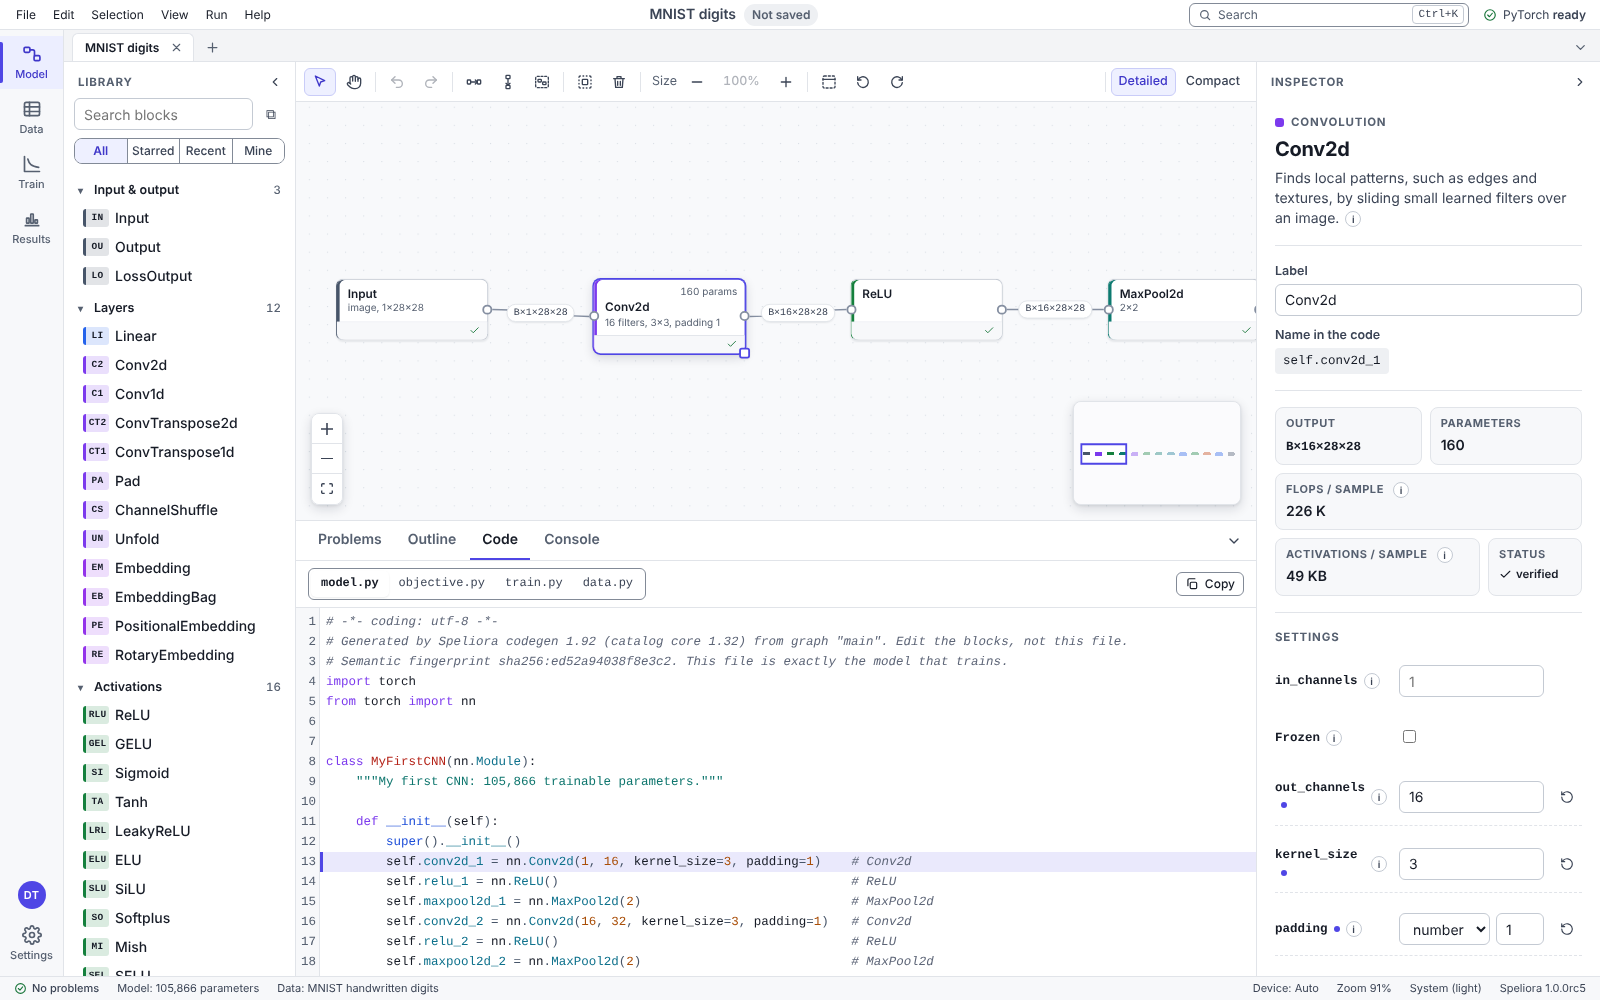
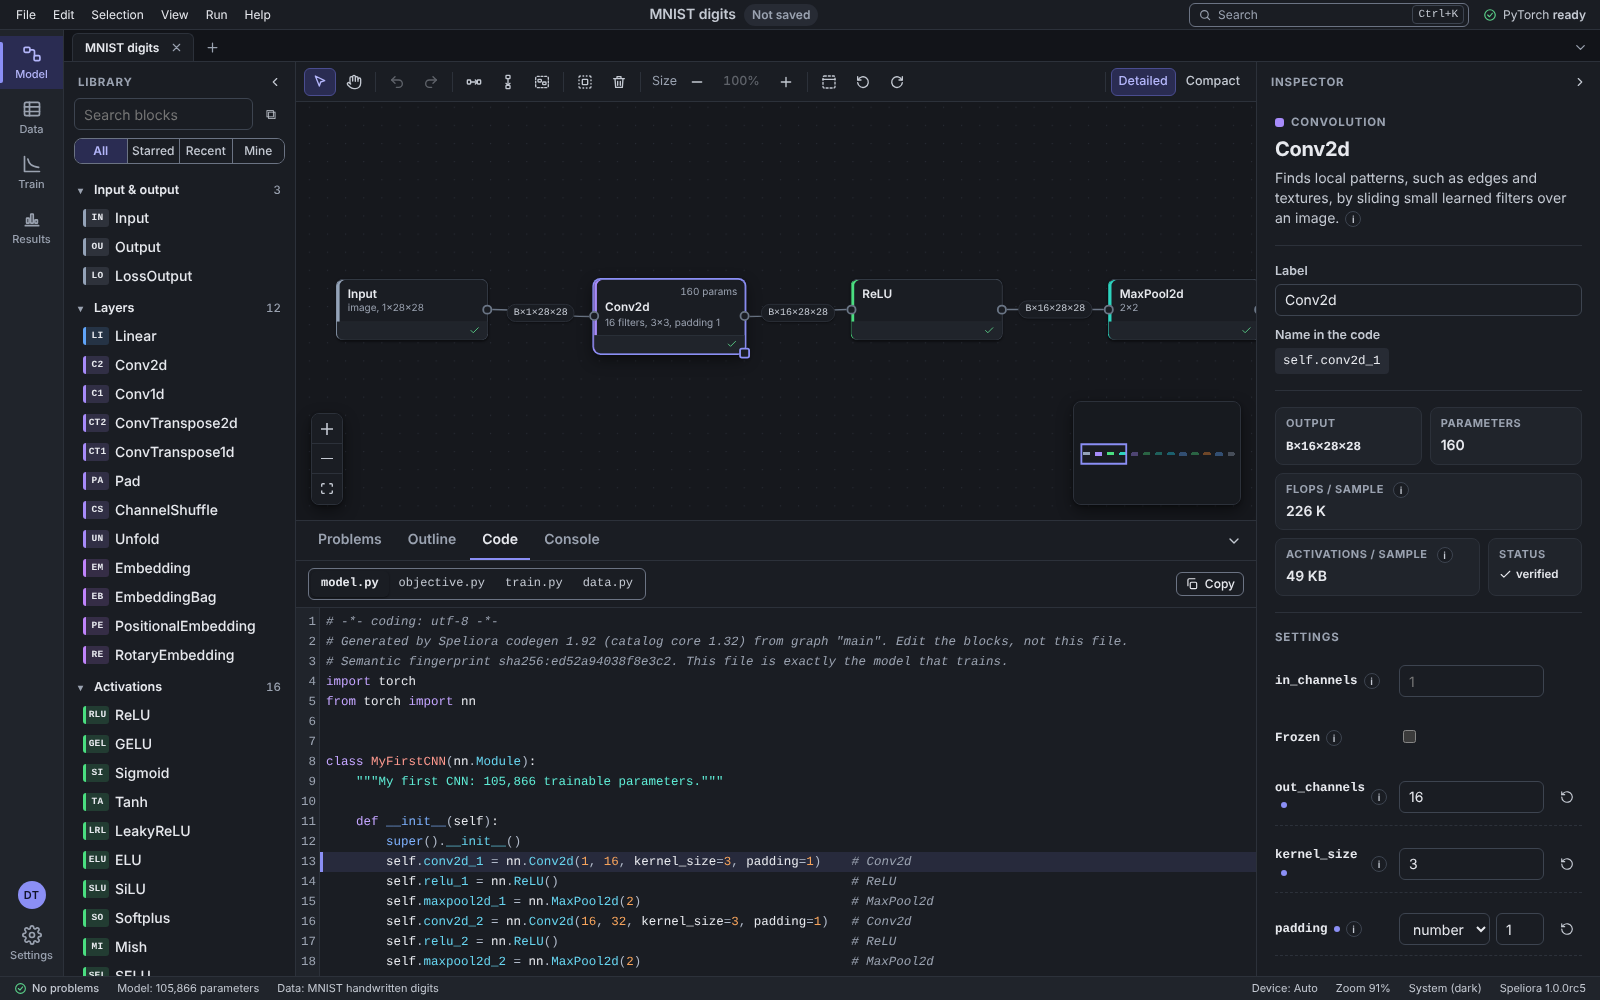
The model editor. An MNIST model built from Input, Conv2d, ReLU and MaxPool2d blocks, with the Conv2d block selected; below it, the model.py code panel highlights that block's line: self.conv2d_1 = nn.Conv2d(1, 16, kernel_size=3, padding=1).The model editor. An MNIST model built from Input, Conv2d, ReLU and MaxPool2d blocks, with the Conv2d block selected; below it, the model.py code panel highlights that block's line: self.conv2d_1 = nn.Conv2d(1, 16, kernel_size=3, padding=1).The model editor. An MNIST model built from Input, Conv2d, ReLU and MaxPool2d blocks, with the Conv2d block selected; below it, the model.py code panel highlights that block's line: self.conv2d_1 = nn.Conv2d(1, 16, kernel_size=3, padding=1).

02 · Data

See the data before it trains.

Built-in data, or your own.
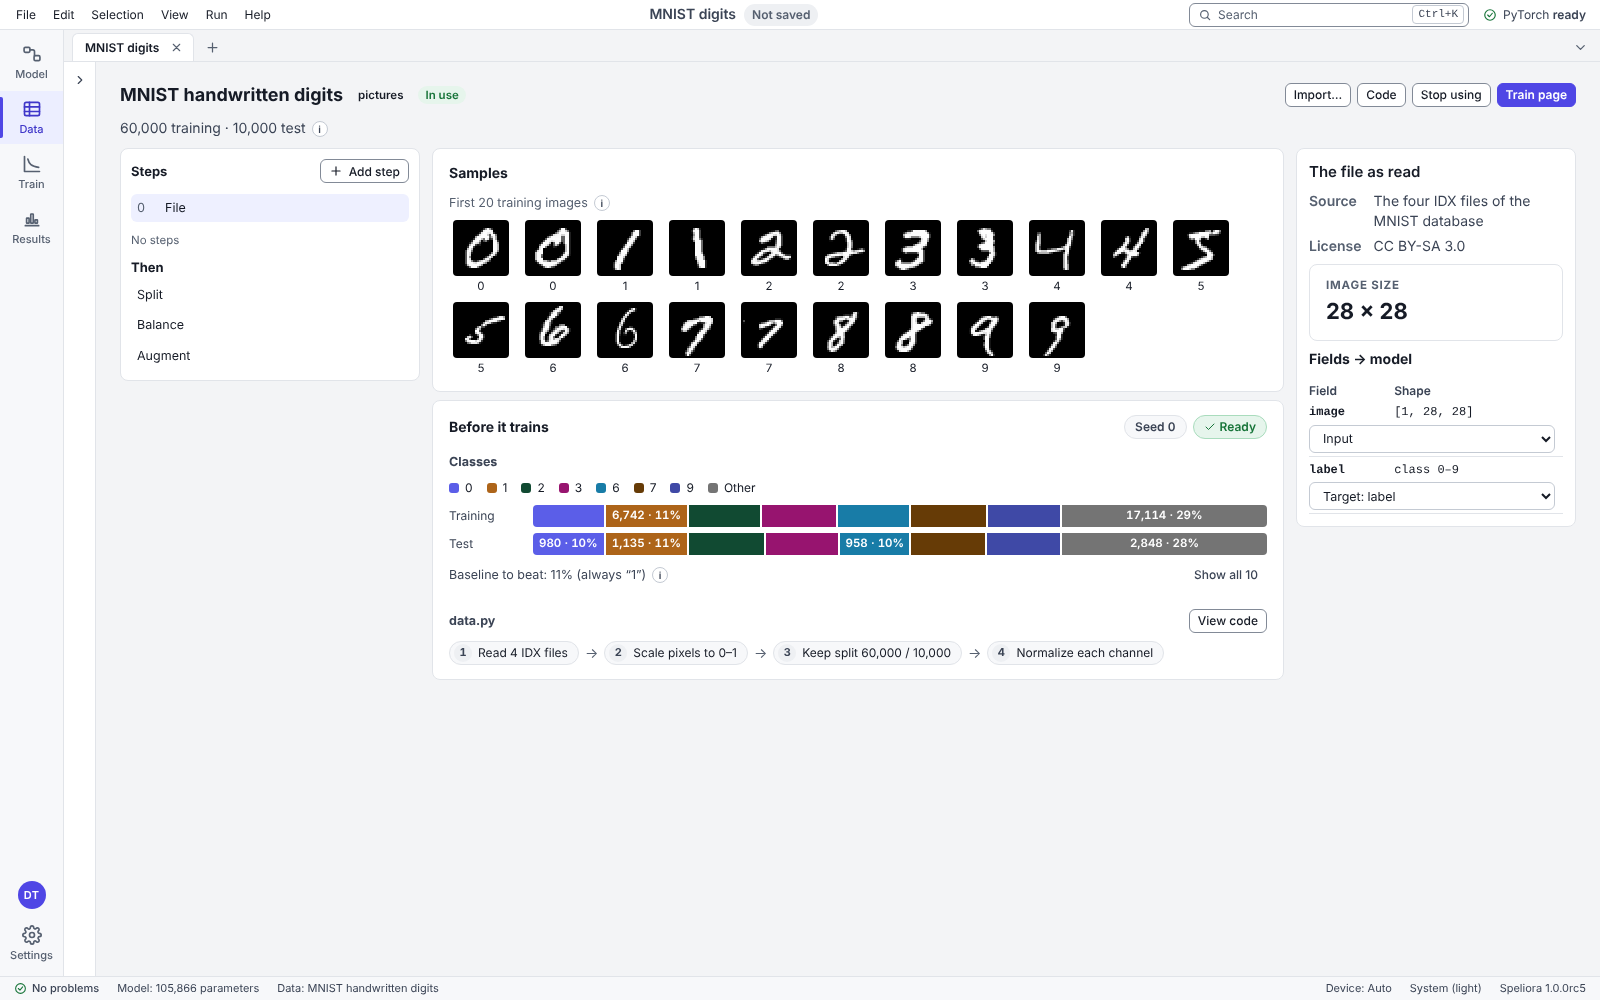
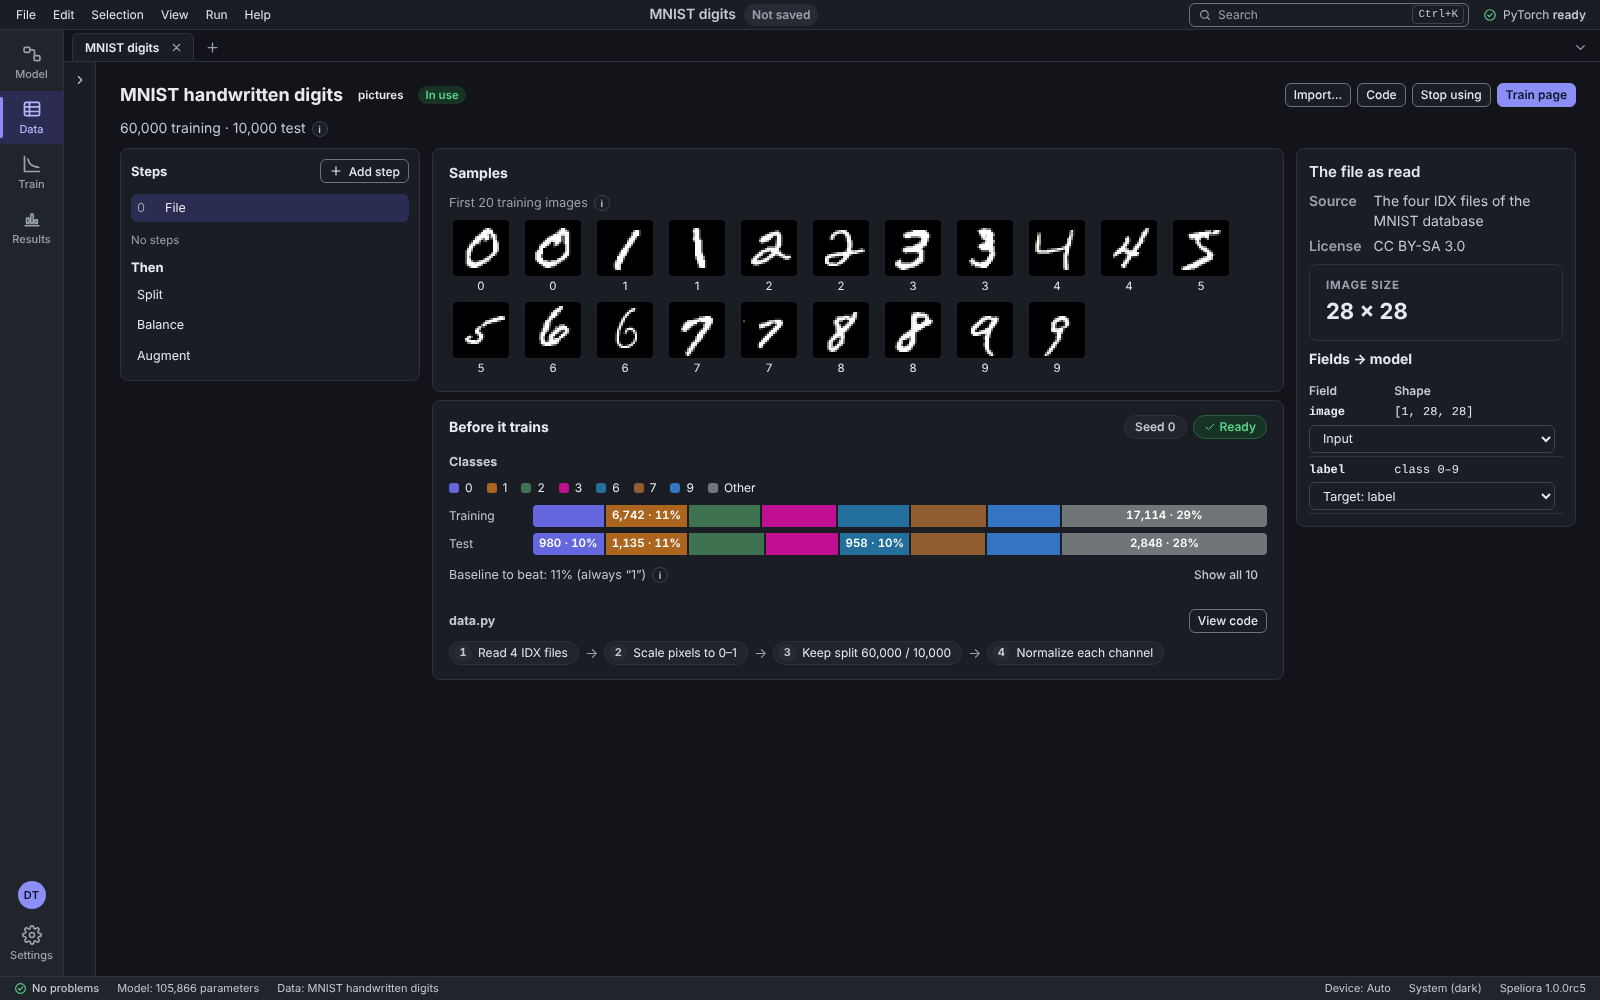
The Data page for MNIST handwritten digits: 70,000 samples of 28 × 28 pixels in 10 classes, the first 20 training images, a 60,000 / 10,000 training and test split, and the fields image and label wired to the model's Input and Target.The Data page for MNIST handwritten digits: 70,000 samples of 28 × 28 pixels in 10 classes, the first 20 training images, a 60,000 / 10,000 training and test split, and the fields image and label wired to the model's Input and Target.The Data page for MNIST handwritten digits: 70,000 samples of 28 × 28 pixels in 10 classes, the first 20 training images, a 60,000 / 10,000 training and test split, and the fields image and label wired to the model's Input and Target.

03 · Train

Train a step at a time, or all the way.

  1. Step

    See exactly what one step changes.
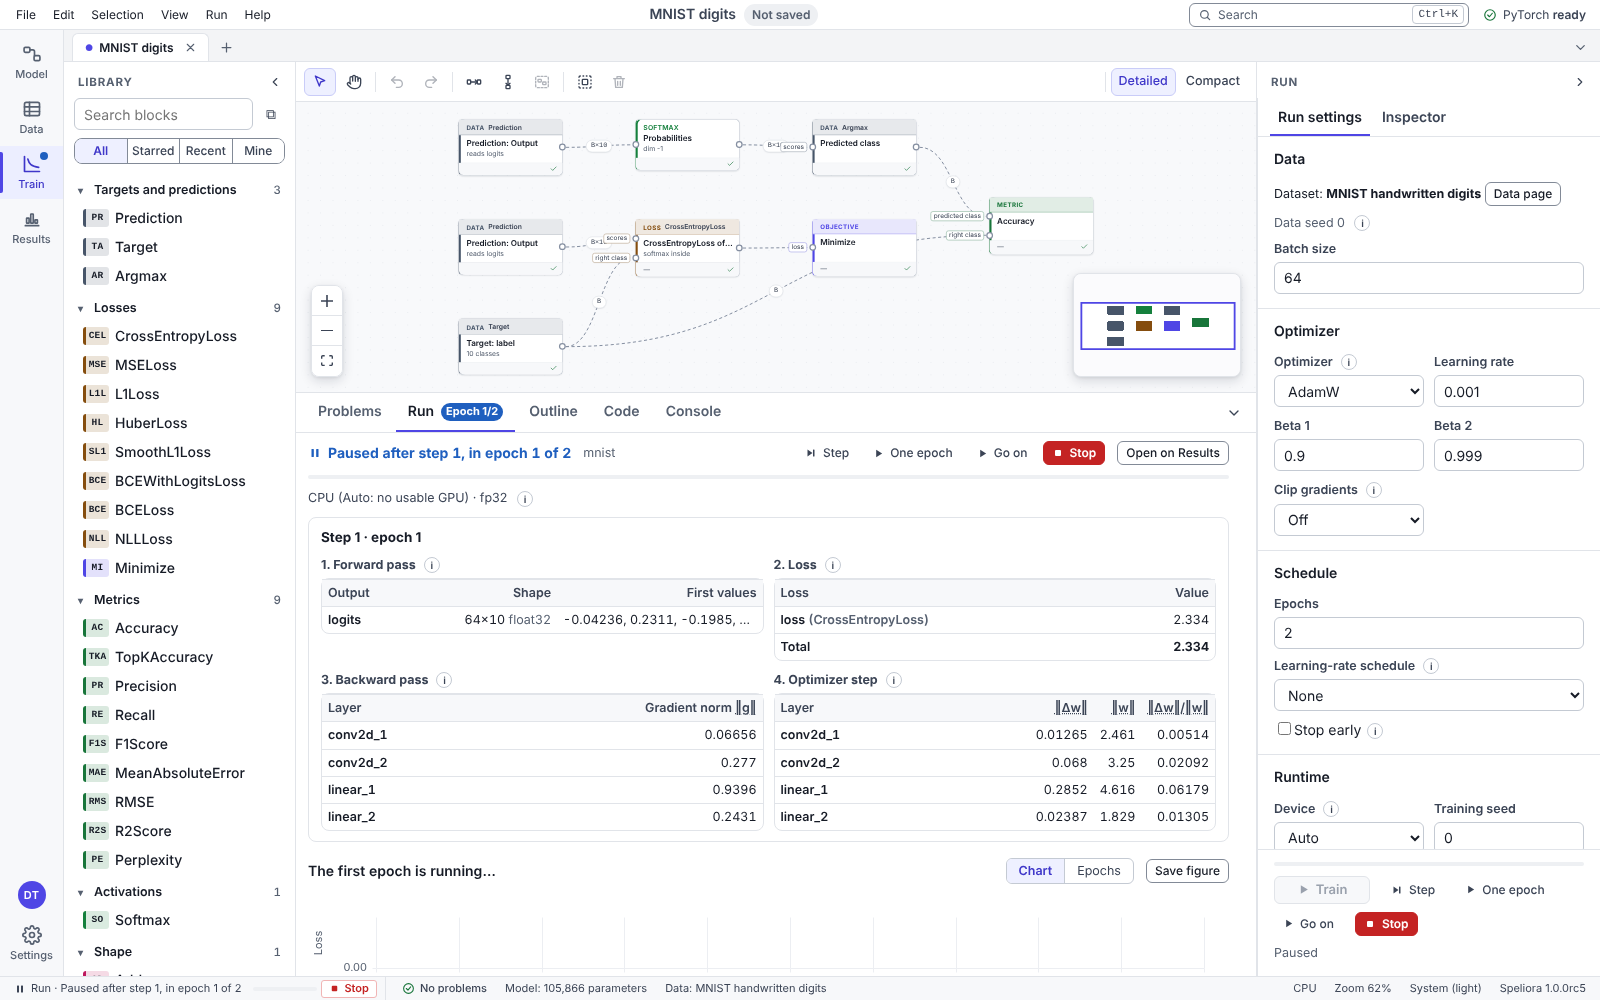
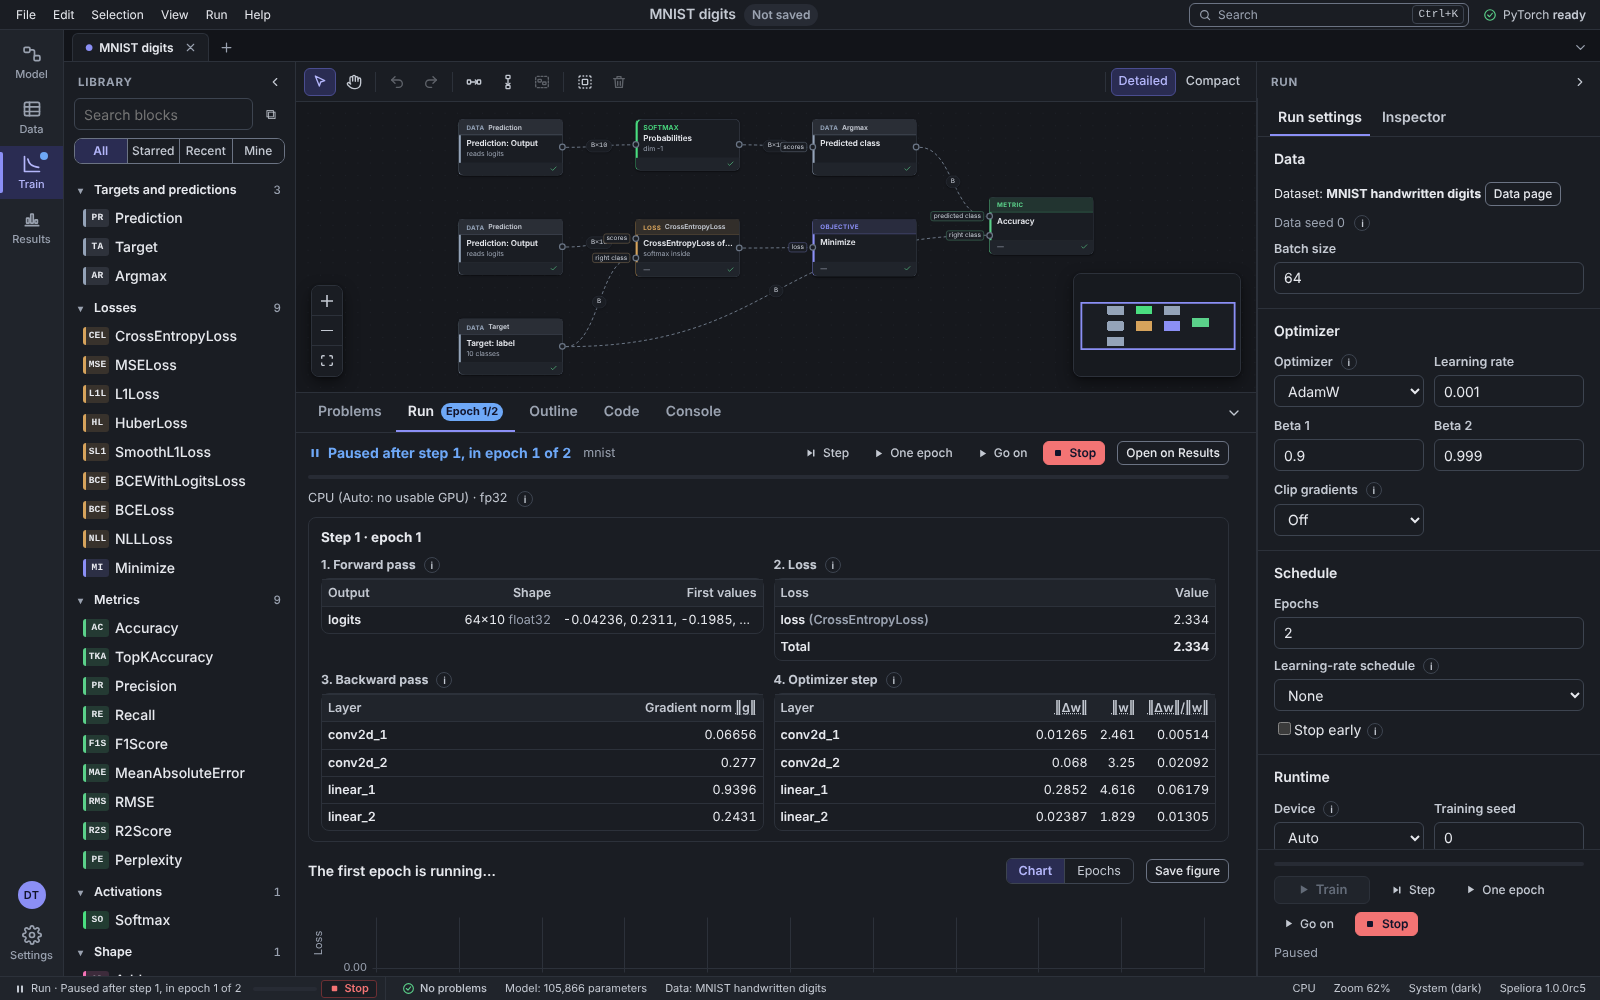
    One training step laid open: paused after step 1 of epoch 1, with the forward pass output, the loss (CrossEntropyLoss 2.334), the gradient norm of each layer in the backward pass, and the size of each layer's update in the optimizer step.One training step laid open: paused after step 1 of epoch 1, with the forward pass output, the loss (CrossEntropyLoss 2.334), the gradient norm of each layer in the backward pass, and the size of each layer's update in the optimizer step.One training step laid open: paused after step 1 of epoch 1, with the forward pass output, the loss (CrossEntropyLoss 2.334), the gradient norm of each layer in the backward pass, and the size of each layer's update in the optimizer step.
  2. One epoch

    Train once through the data, then pause and look.
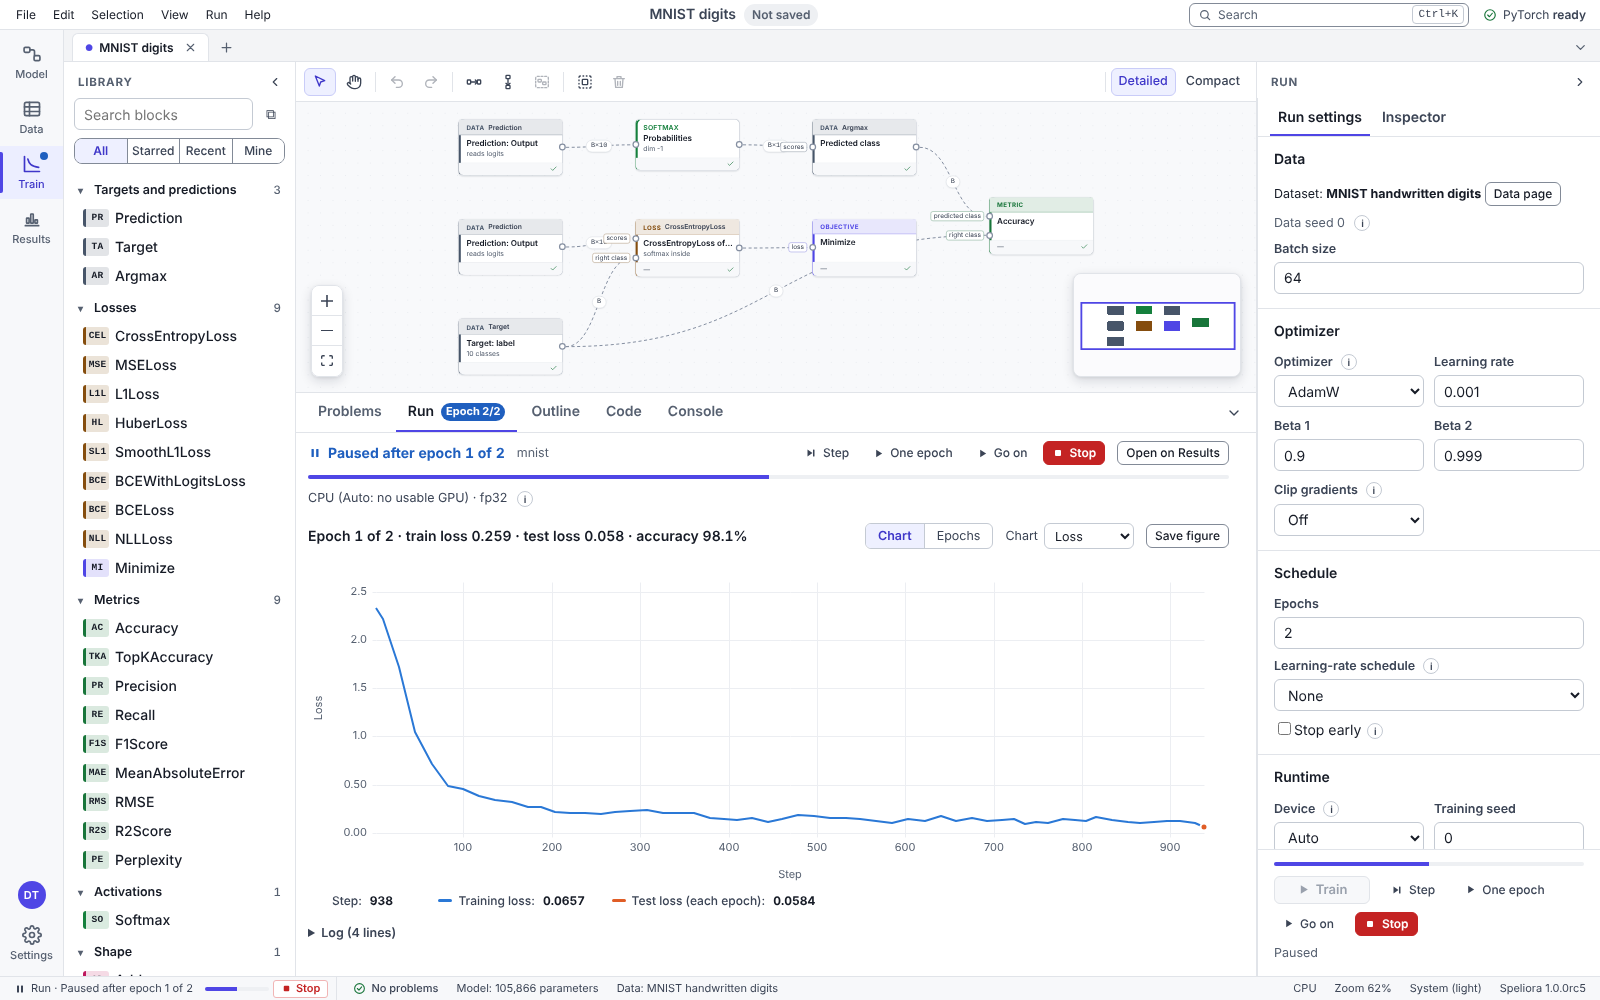
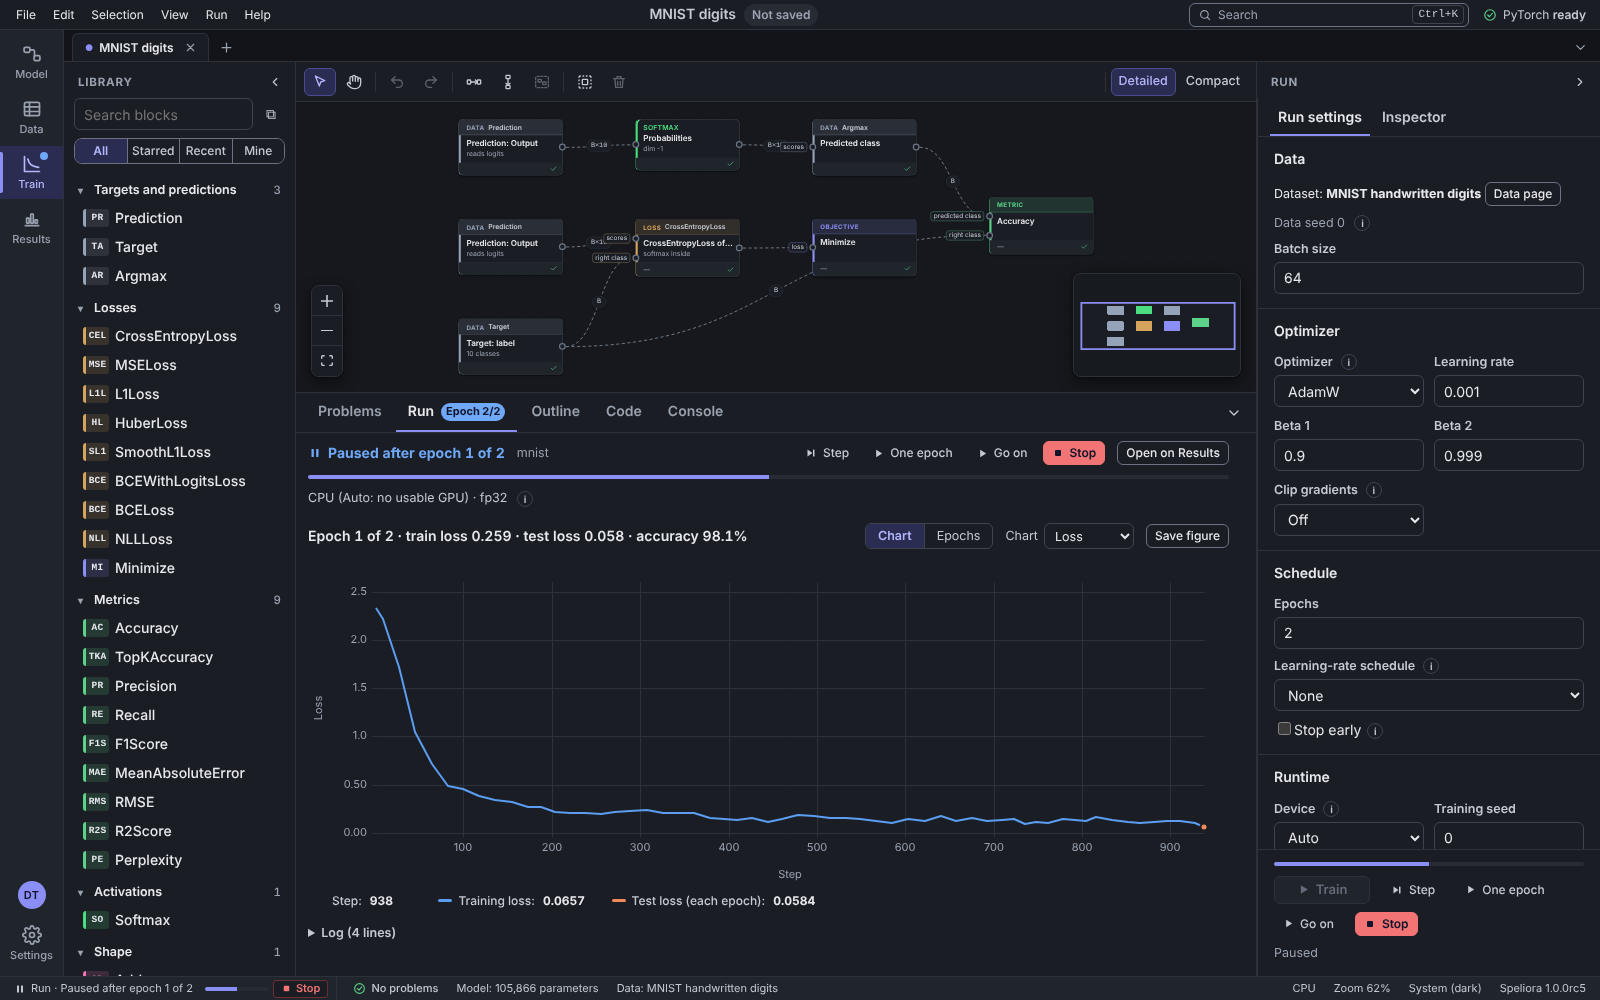
    Training paused after epoch 1 of 2: train loss 0.259, test loss 0.058, accuracy 98.1%, with the training-loss chart falling from 2.334 at step 1, and buttons for Step, One epoch and Go on.Training paused after epoch 1 of 2: train loss 0.259, test loss 0.058, accuracy 98.1%, with the training-loss chart falling from 2.334 at step 1, and buttons for Step, One epoch and Go on.Training paused after epoch 1 of 2: train loss 0.259, test loss 0.058, accuracy 98.1%, with the training-loss chart falling from 2.334 at step 1, and buttons for Step, One epoch and Go on.
  3. Run to this block

    See what one layer makes of a batch.
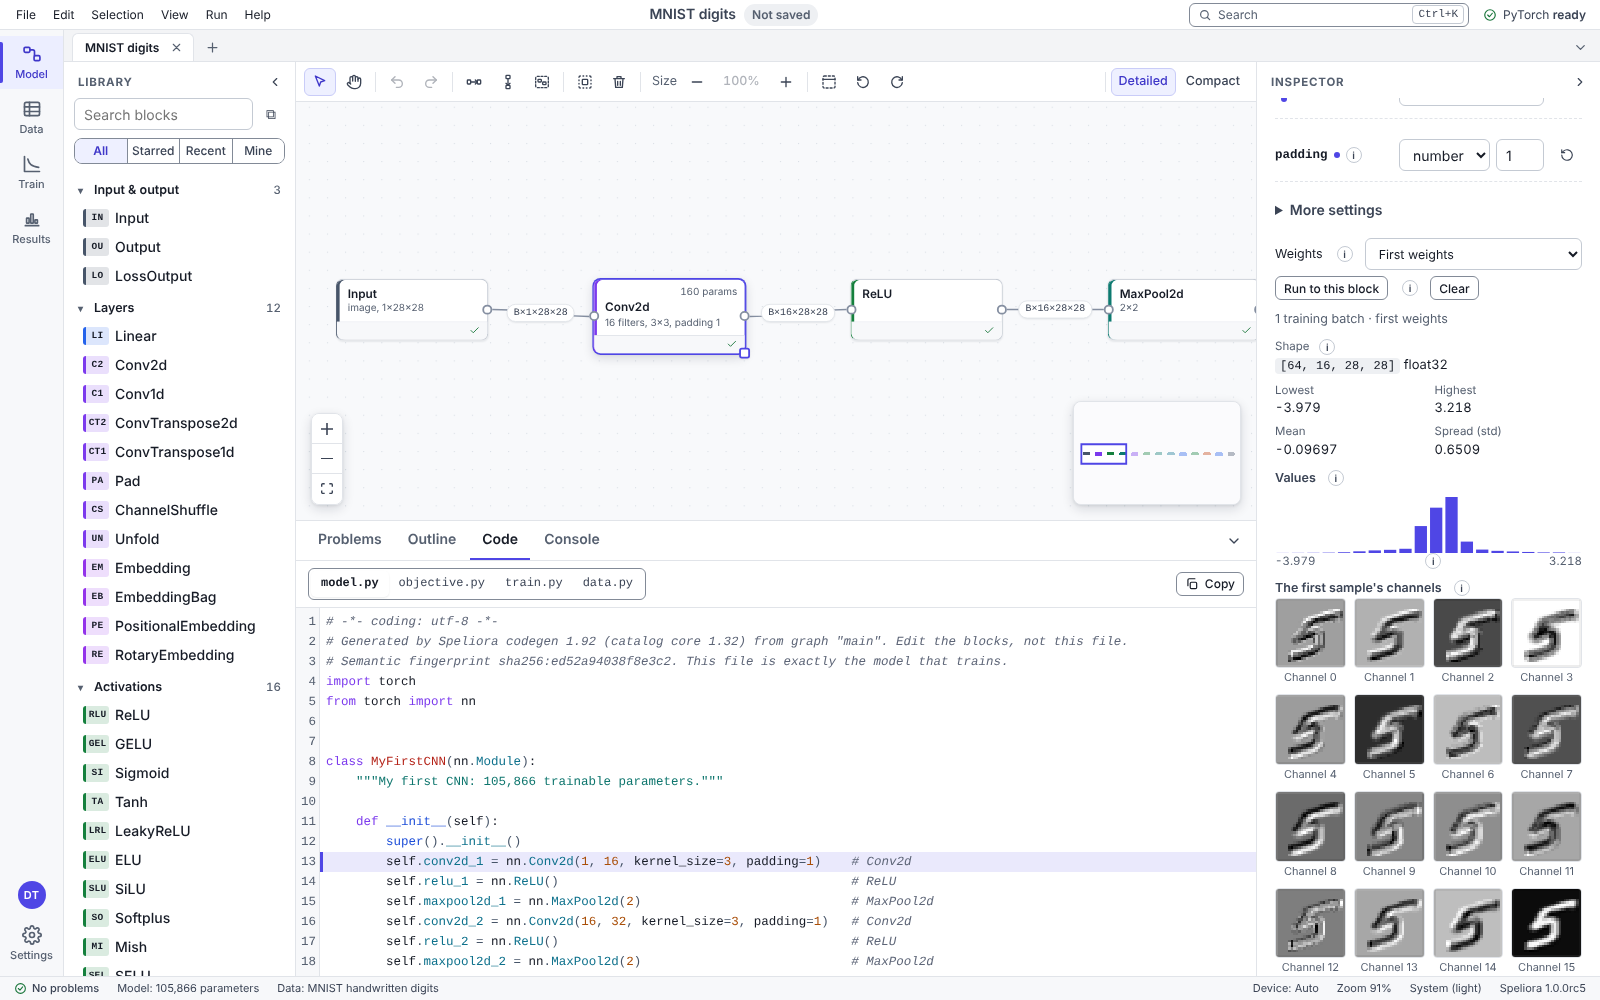
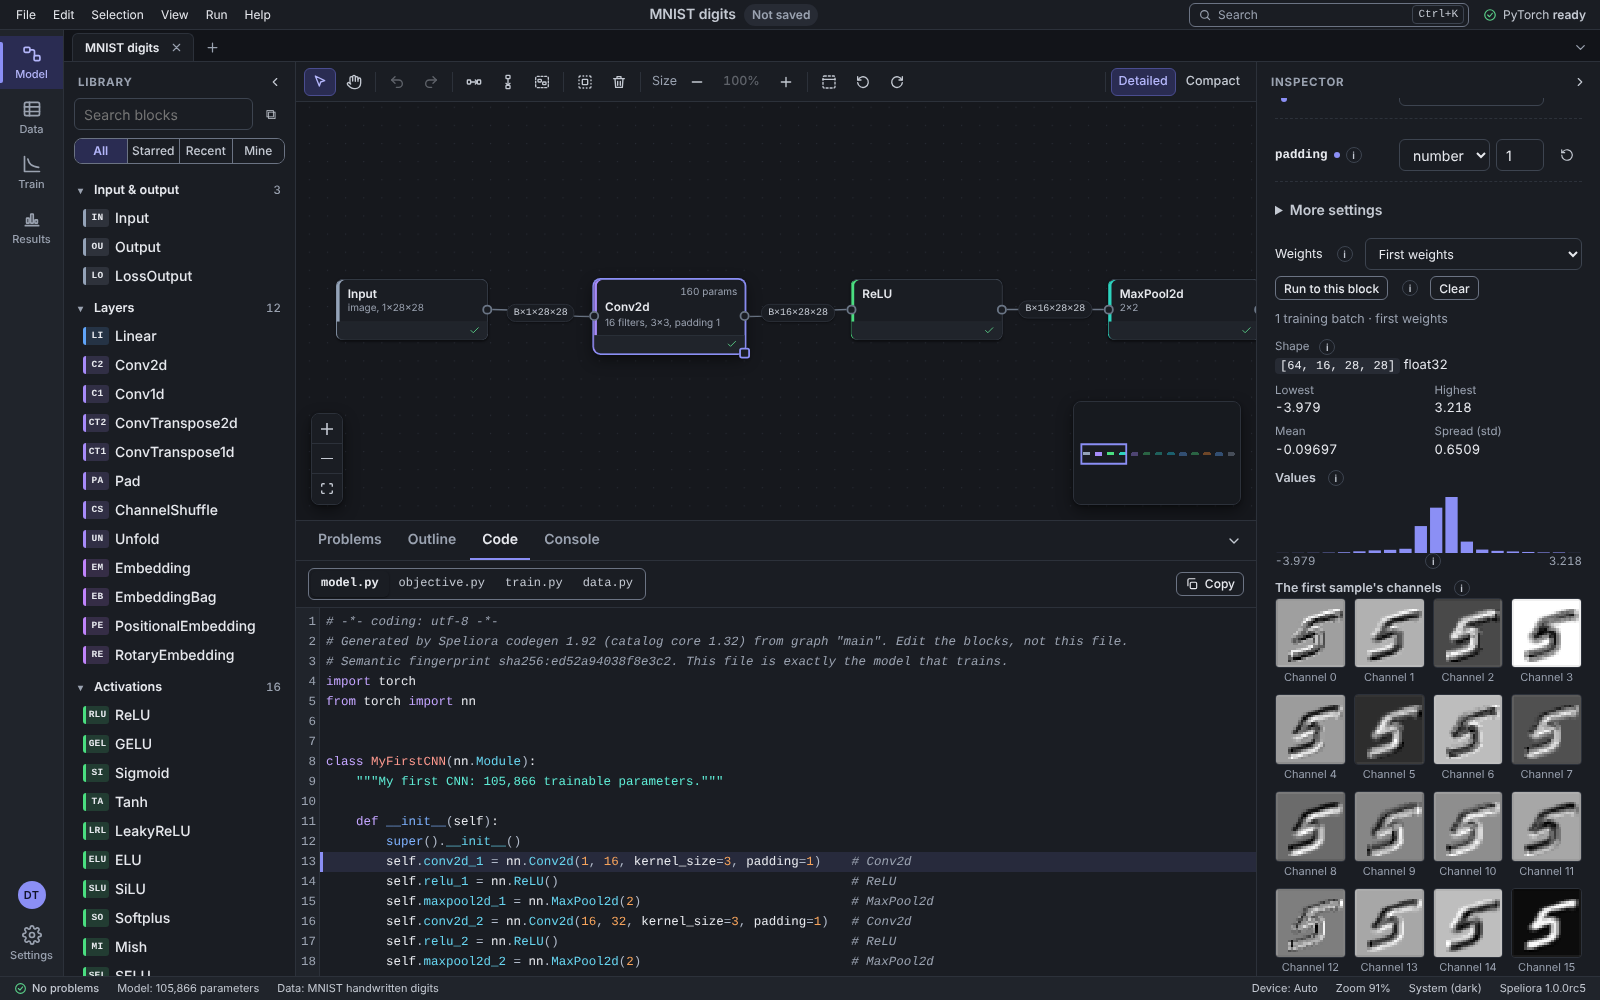
    Run to this block on a Conv2d: for one training batch, the inspector shows the output shape [64, 16, 28, 28], its lowest, highest and mean values, a histogram, and the 16 feature maps of the first sample, each a differently filtered handwritten 5.Run to this block on a Conv2d: for one training batch, the inspector shows the output shape [64, 16, 28, 28], its lowest, highest and mean values, a histogram, and the 16 feature maps of the first sample, each a differently filtered handwritten 5.Run to this block on a Conv2d: for one training batch, the inspector shows the output shape [64, 16, 28, 28], its lowest, highest and mean values, a histogram, and the 16 feature maps of the first sample, each a differently filtered handwritten 5.
  4. Faster with a graphics card

    Optional: NVIDIA.
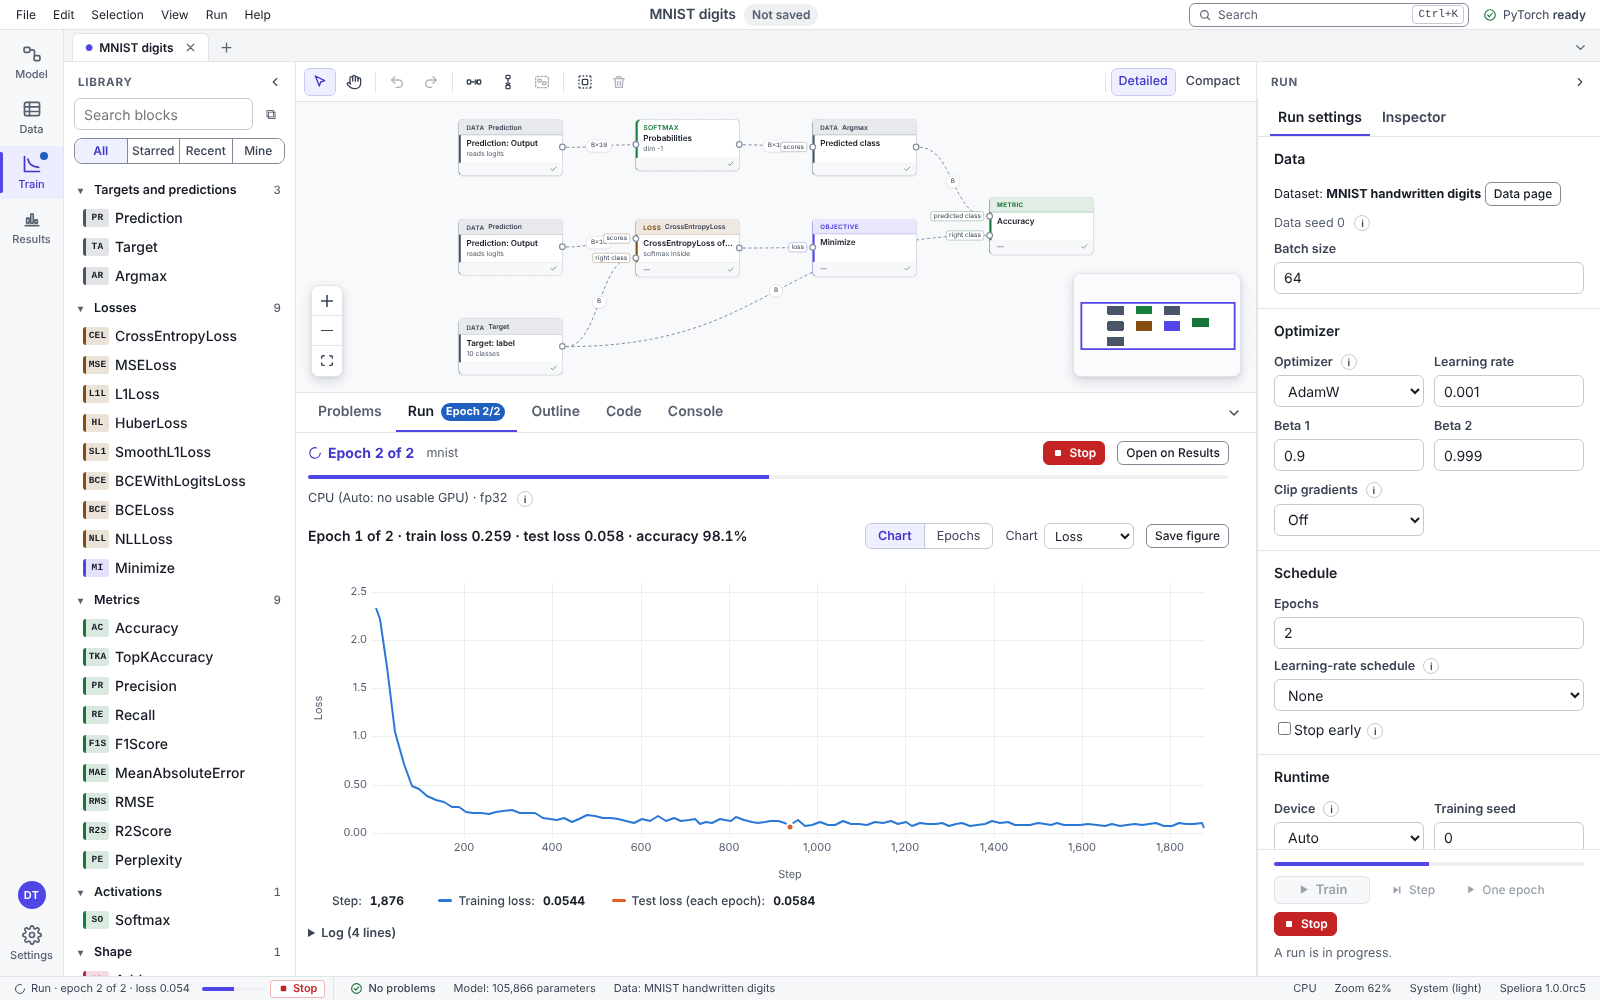
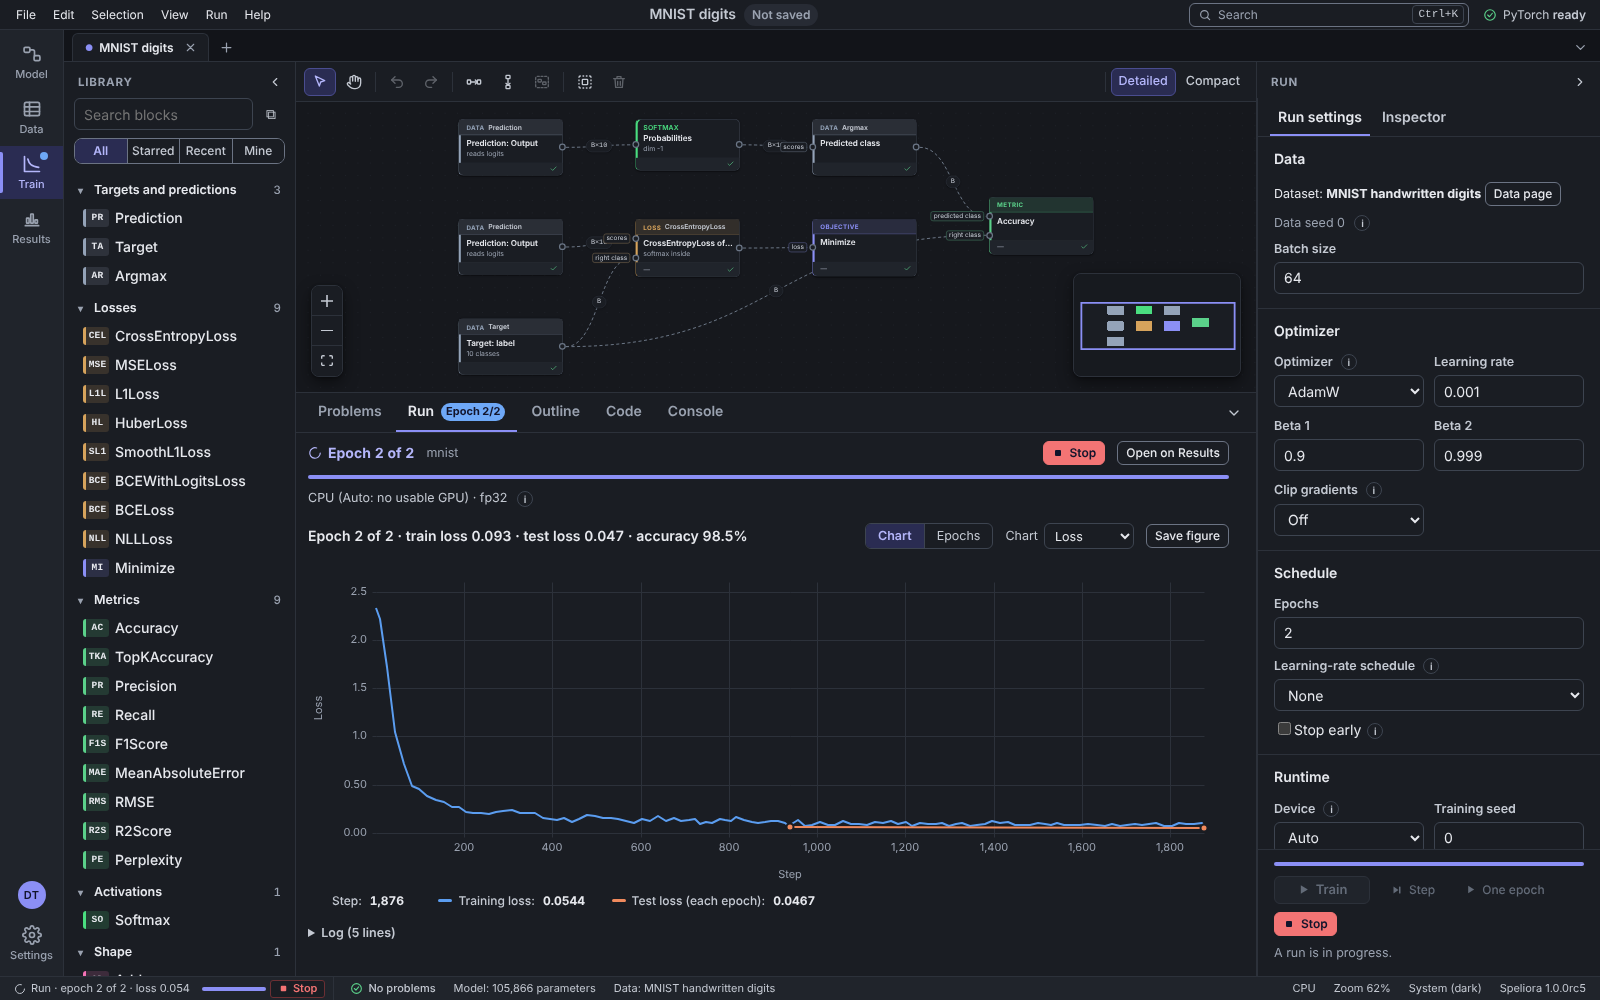
    Training running in epoch 2 of 2 on the CPU, with the loss chart drawing live: training loss went from 2.334 at step 1 to 0.0544 at step 1,876.Training running in epoch 2 of 2 on the CPU, with the loss chart drawing live: training loss went from 2.334 at step 1 to 0.0544 at step 1,876.Training running in epoch 2 of 2 on the CPU, with the loss chart drawing live: training loss went from 2.334 at step 1 to 0.0544 at step 1,876.
One training step laid open: paused after step 1 of epoch 1, with the forward pass output, the loss (CrossEntropyLoss 2.334), the gradient norm of each layer in the backward pass, and the size of each layer's update in the optimizer step.One training step laid open: paused after step 1 of epoch 1, with the forward pass output, the loss (CrossEntropyLoss 2.334), the gradient norm of each layer in the backward pass, and the size of each layer's update in the optimizer step.One training step laid open: paused after step 1 of epoch 1, with the forward pass output, the loss (CrossEntropyLoss 2.334), the gradient norm of each layer in the backward pass, and the size of each layer's update in the optimizer step.
Training paused after epoch 1 of 2: train loss 0.259, test loss 0.058, accuracy 98.1%, with the training-loss chart falling from 2.334 at step 1, and buttons for Step, One epoch and Go on.Training paused after epoch 1 of 2: train loss 0.259, test loss 0.058, accuracy 98.1%, with the training-loss chart falling from 2.334 at step 1, and buttons for Step, One epoch and Go on.Training paused after epoch 1 of 2: train loss 0.259, test loss 0.058, accuracy 98.1%, with the training-loss chart falling from 2.334 at step 1, and buttons for Step, One epoch and Go on.
Run to this block on a Conv2d: for one training batch, the inspector shows the output shape [64, 16, 28, 28], its lowest, highest and mean values, a histogram, and the 16 feature maps of the first sample, each a differently filtered handwritten 5.Run to this block on a Conv2d: for one training batch, the inspector shows the output shape [64, 16, 28, 28], its lowest, highest and mean values, a histogram, and the 16 feature maps of the first sample, each a differently filtered handwritten 5.Run to this block on a Conv2d: for one training batch, the inspector shows the output shape [64, 16, 28, 28], its lowest, highest and mean values, a histogram, and the 16 feature maps of the first sample, each a differently filtered handwritten 5.
Training running in epoch 2 of 2 on the CPU, with the loss chart drawing live: training loss went from 2.334 at step 1 to 0.0544 at step 1,876.Training running in epoch 2 of 2 on the CPU, with the loss chart drawing live: training loss went from 2.334 at step 1 to 0.0544 at step 1,876.Training running in epoch 2 of 2 on the CPU, with the loss chart drawing live: training loss went from 2.334 at step 1 to 0.0544 at step 1,876.

04 · Results

See what it gets right, and what it gets wrong.

Mistakes first.
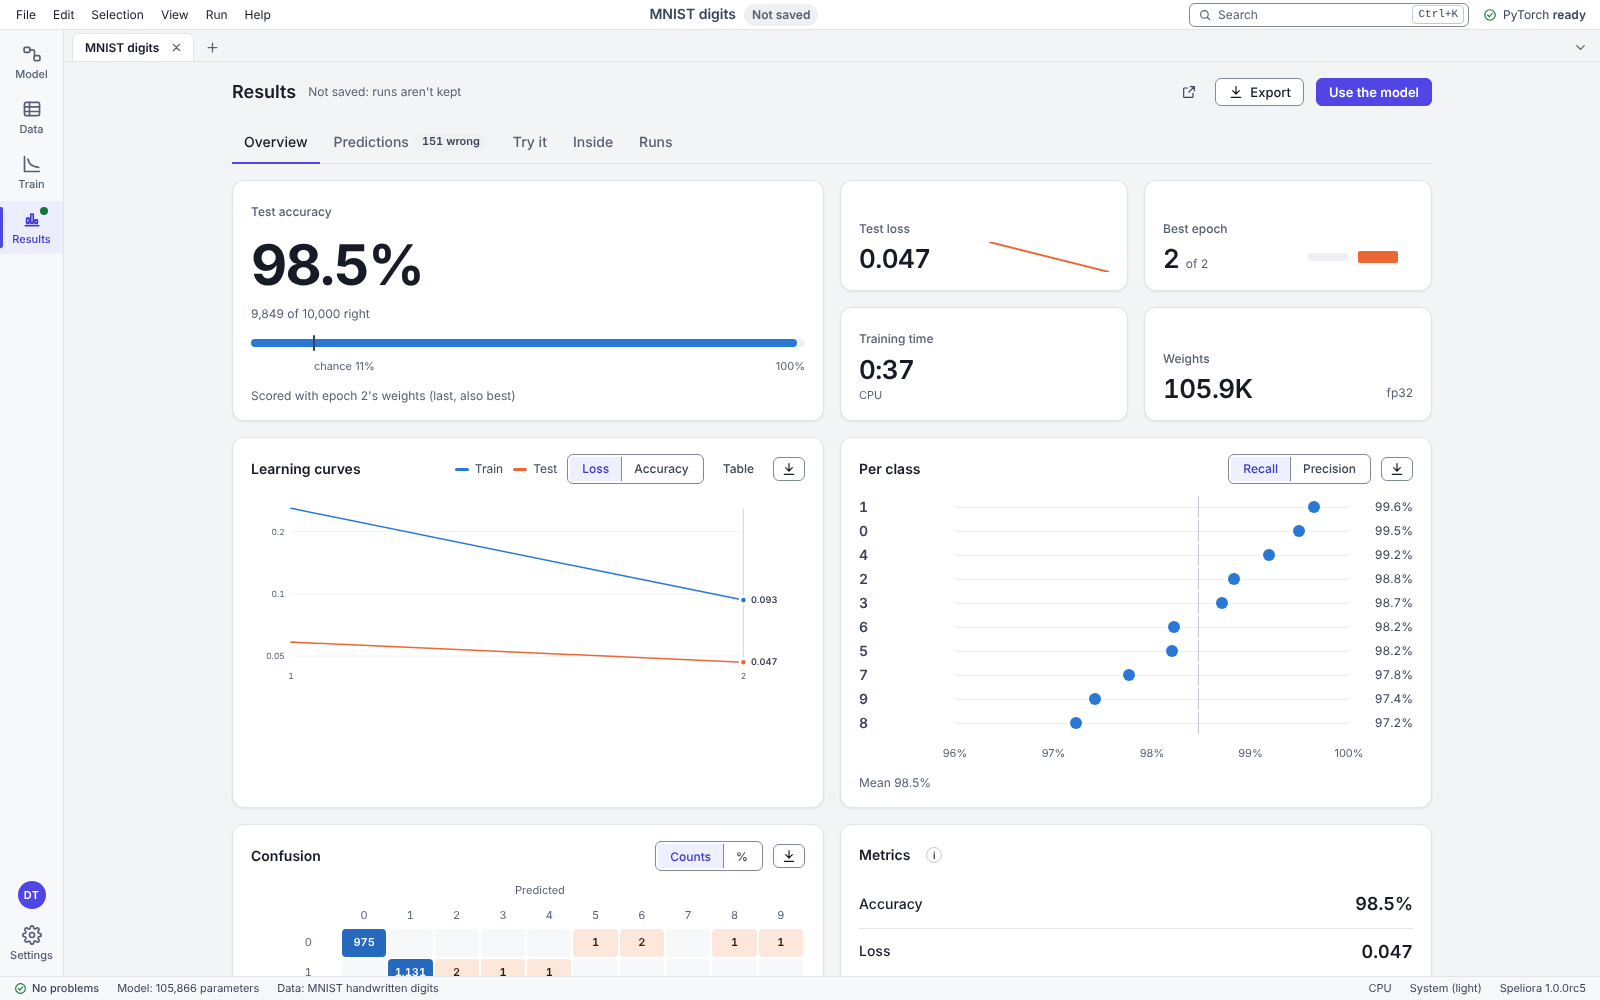
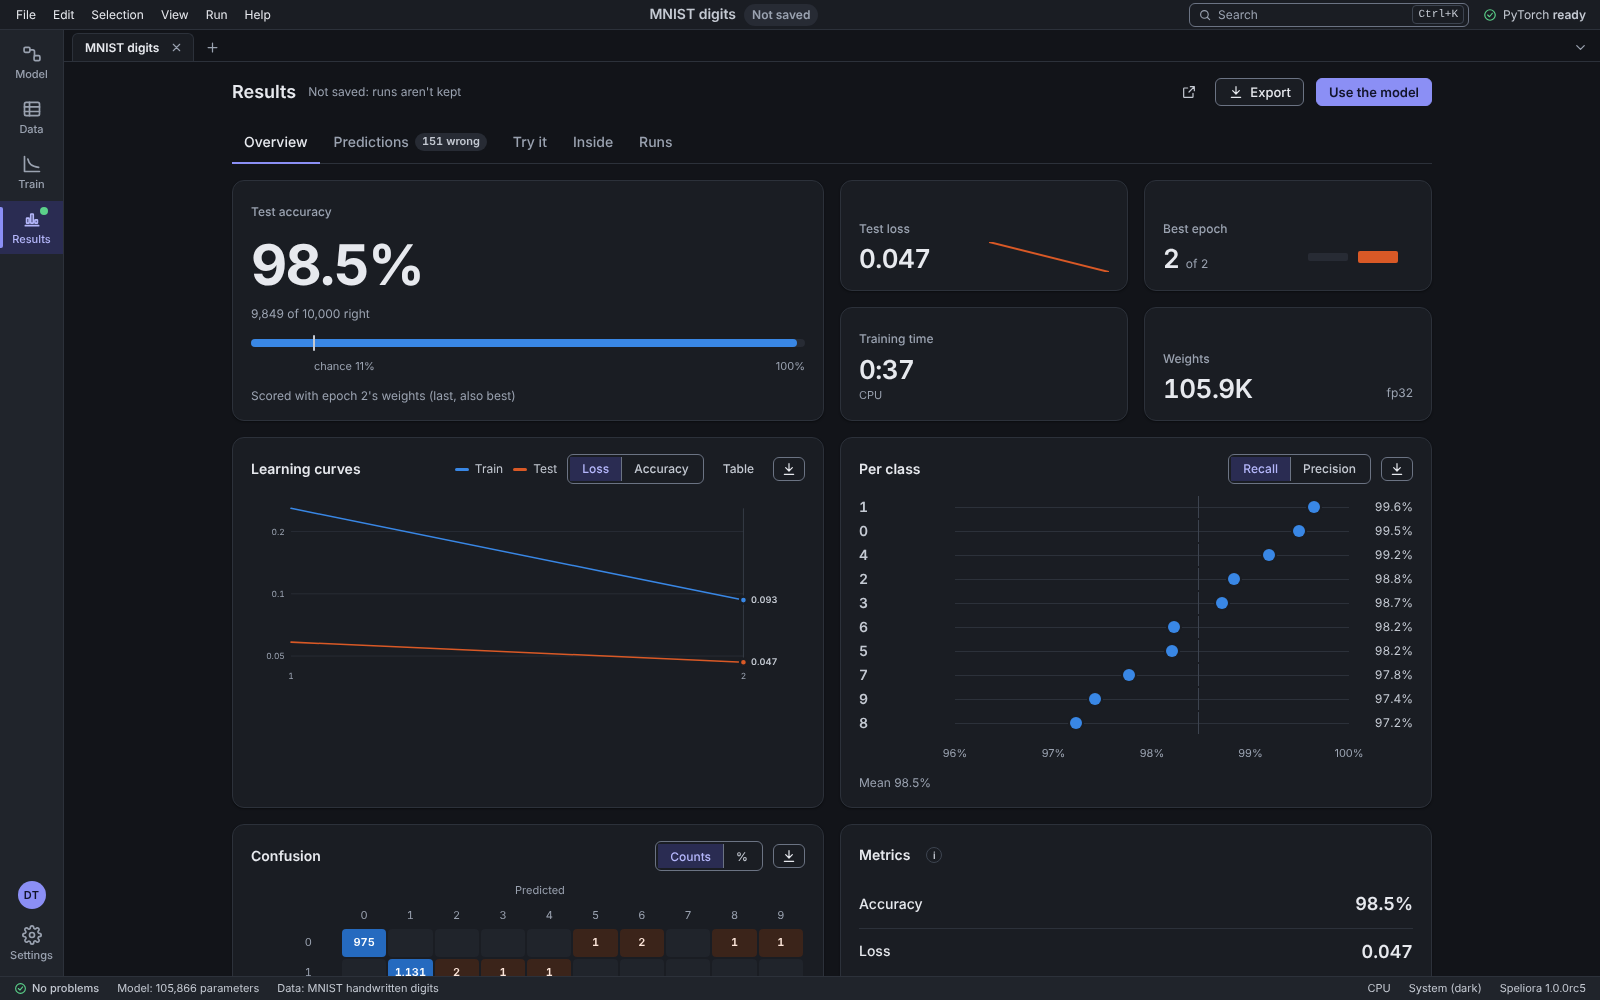
The Results page: test accuracy 98.5%, 9,849 of 10,000 samples right, after 2 epochs on CPU. A confusion matrix of the ten digits with the right answers on the diagonal, the accuracy of each class, and the test predictions with the wrong ones first.The Results page: test accuracy 98.5%, 9,849 of 10,000 samples right, after 2 epochs on CPU. A confusion matrix of the ten digits with the right answers on the diagonal, the accuracy of each class, and the test predictions with the wrong ones first.The Results page: test accuracy 98.5%, 9,849 of 10,000 samples right, after 2 epochs on CPU. A confusion matrix of the ten digits with the right answers on the diagonal, the accuracy of each class, and the test predictions with the wrong ones first.

The download is coming soon.

The Windows app is getting ready for its first release.

Windows download coming soonWhat the computer will need